Service drive performance · Intermountain Digital Solutions

Every menu you don't present
is revenue you never see.

CORE shows you exactly where your service drive is leaving money behind — advisor by advisor, day by day — then gives your managers the coaching tools and your advisors the real incentives to close the gap.

Contact to learn moreContact
Reads straight from your DMS No spreadsheets, no manual entry Live in days, not months
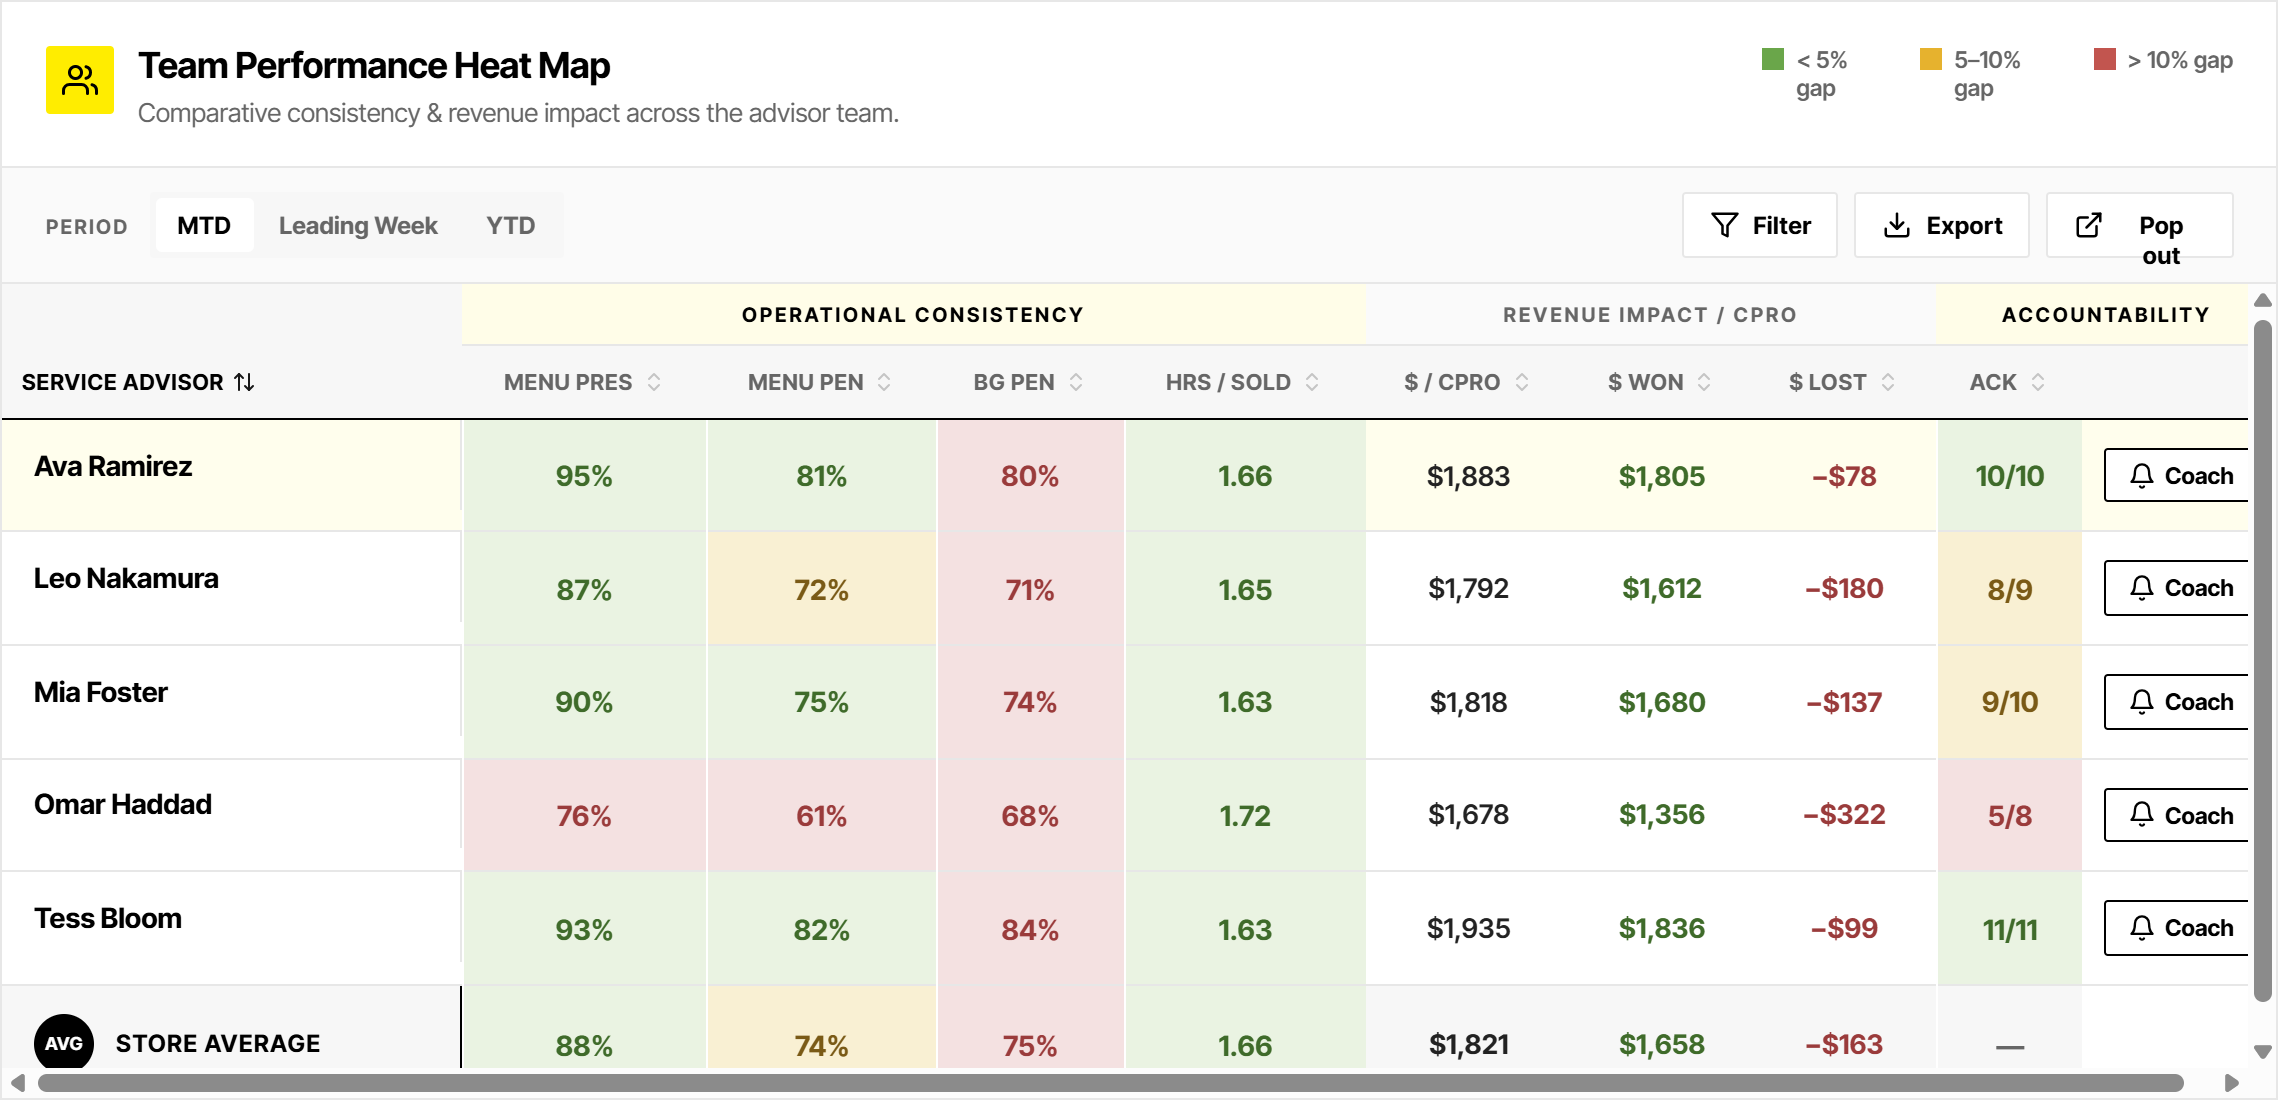
CORE team performance heat map showing menu presentation, menu penetration, BG penetration and revenue impact per advisor
The problem

Your drive is producing
more than you can see.

The opportunity is already walking through the door. What's missing is a way to know — every single day — which advisor took it and which one let it go.

01

Menus never presented

Every customer-pay RO without a menu is a sale that was never offered. It doesn't show up as a loss anywhere, so nobody chases it.

02

No real visibility

You know your store number. You don't know which of your five advisors is carrying it and which is quietly dragging it down.

03

Nothing lands day to day

A monthly review is a post-mortem. Without a daily habit, advisors never connect yesterday's behavior to this month's result.

04

Reporting buried in the DMS

The data exists. Getting it out means exports, pivot tables, and a manager doing analysis instead of coaching.

05

Five advisors, five processes

Without a shared standard and a shared scoreboard, "the process" is whatever each advisor decides it is that morning.

Your opportunity

Put a number on
what you're leaving behind.

We won't quote you someone else's results. Use your own numbers — this is the same conservative model CORE runs in-product.

Across the whole service drive.
%
Share of those ROs where a menu is actually shown.
%
Of presented menus, how many convert.
$
Realized dollars per menu sold.
Estimated annual opportunity
$0

Recoverable menu revenue currently walking out the door.

ROs with no menu presented0
Recoverable menu sales per month0
Monthly revenue opportunity$0

How this is calculated: unpresented ROs × your close rate × a deliberate 25% haircut, because an RO that got skipped is less likely to buy than one you chose to present to. CORE uses the same discount in-product — we would rather understate the opportunity than oversell it.

The platform

See the gap. Coach the gap.
Reward the close.

CORE is built around one loop: measure the behavior that drives revenue, put it in front of the person who owns it, and make closing the gap worth their while.

Heat map

Every advisor, every metric, one screen.

Green, yellow, red against your store's own targets — so a manager can see in three seconds who needs a conversation today. Sort any column, filter to who needs attention, pop it out for a team meeting.

  • Menu presentation, menu penetration, BG penetration and labor hours per menu sold
  • Revenue impact per customer-pay RO — won, lost, and net
  • Thresholds you set yourself, per metric, per store
  • Store average that reflects the whole team, not just who's on screen
Heat map with per-advisor metrics coloured green, yellow and red against store targets
Goals & incentives

Give the whole team something to chase.

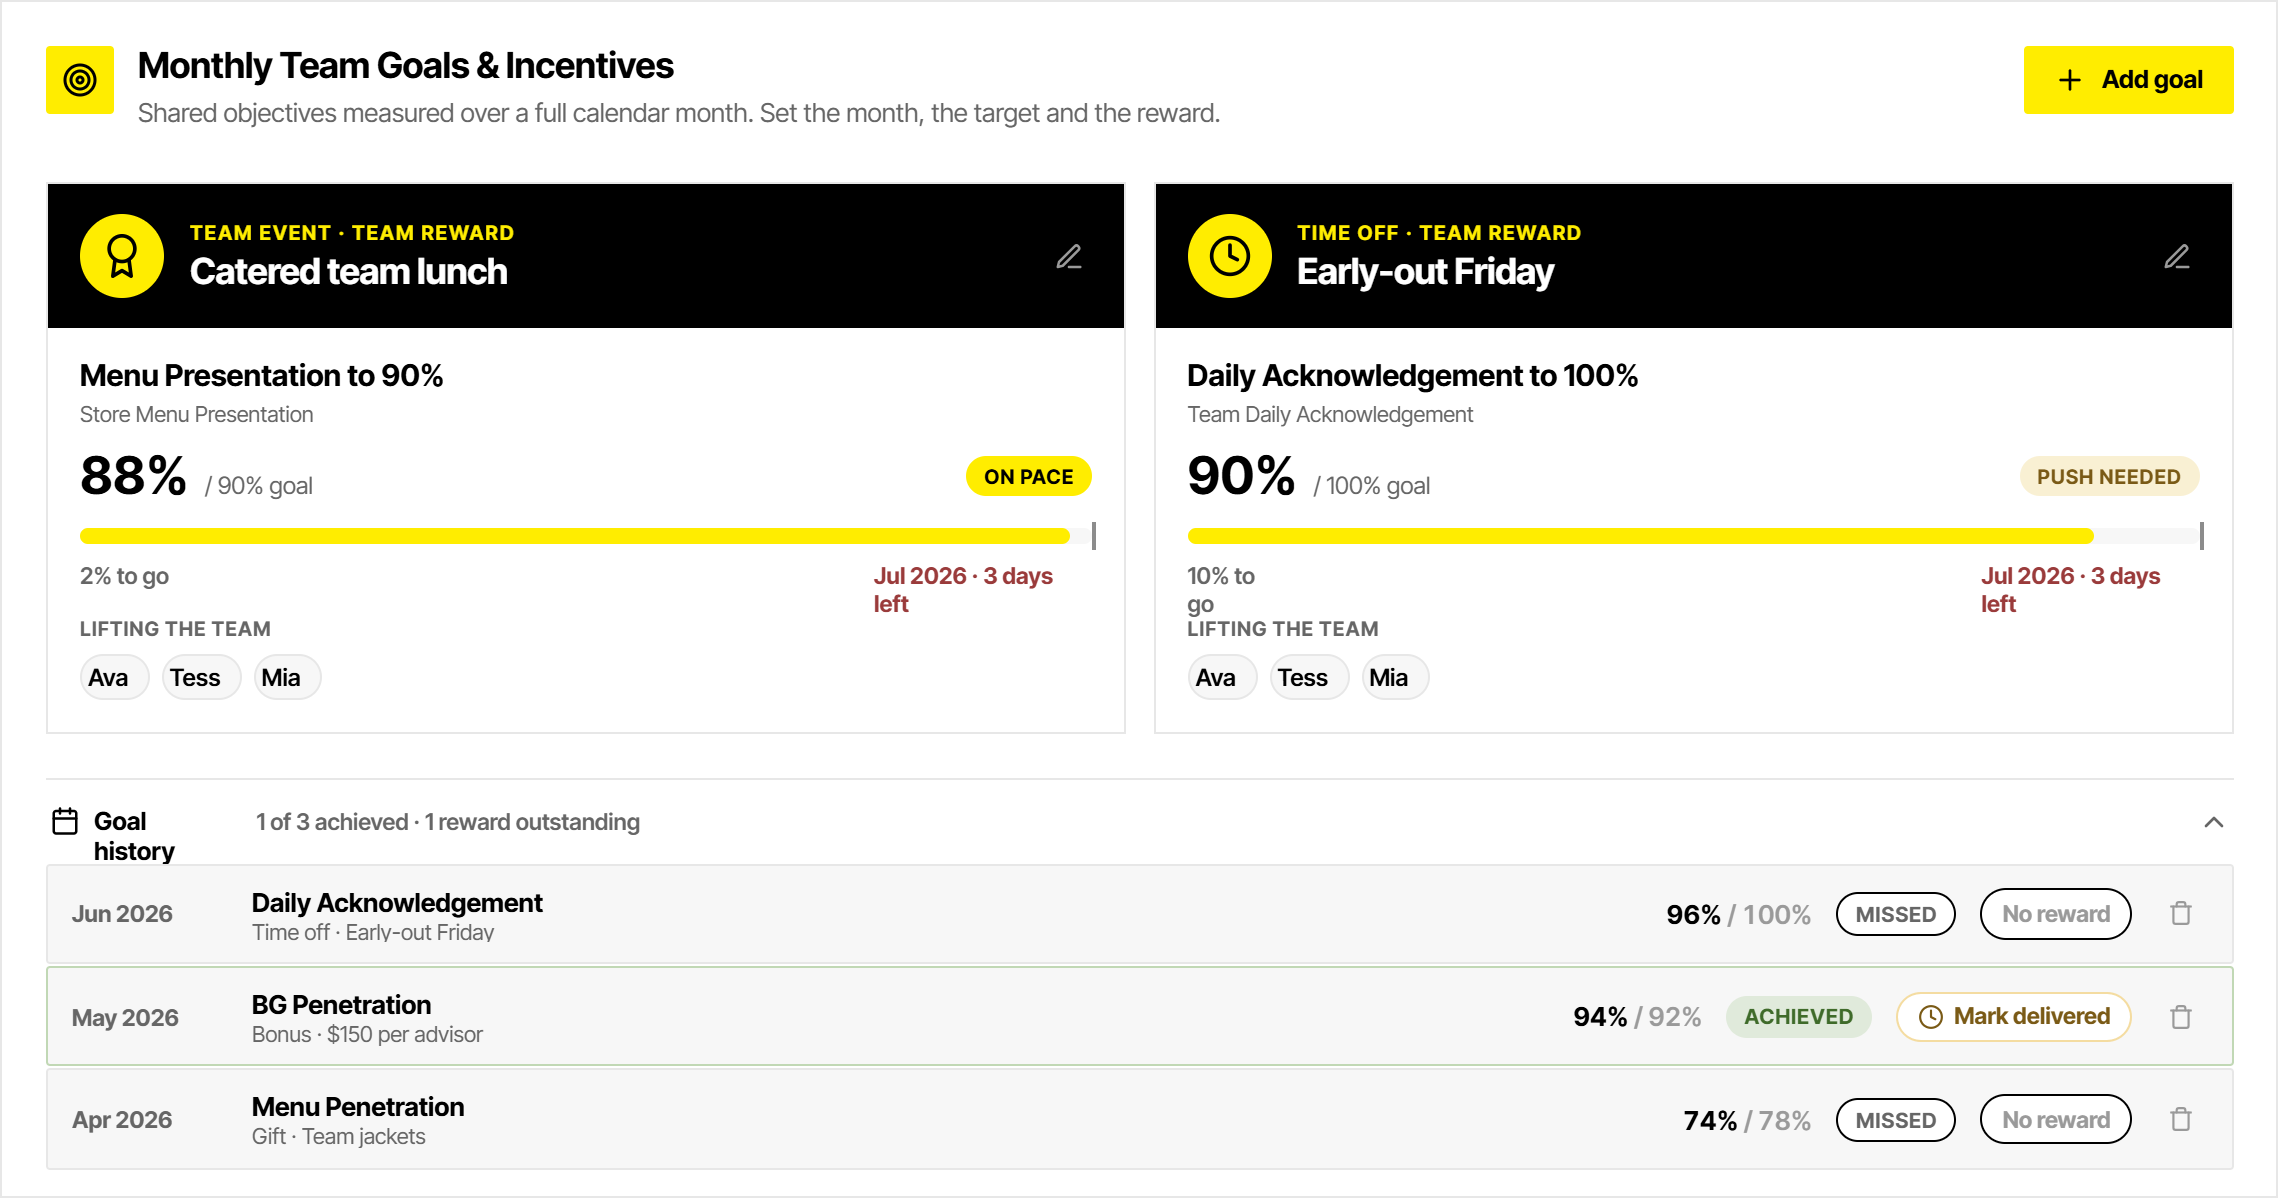
Set a monthly team target on any CORE metric and attach a real reward to it — a catered lunch, a cash bonus, an early-out Friday. Everyone sees the same progress bar and who's lifting it.

  • Measured across the full calendar month, no ambiguity about the window
  • Up to three live goals, so focus stays where it matters
  • Full history of what was achieved, missed, and delivered
  • Managers mark rewards delivered — the team can see it happened
Monthly team goals and incentives panel with progress toward target and goal history
Recognition

Compete against the process, not each other.

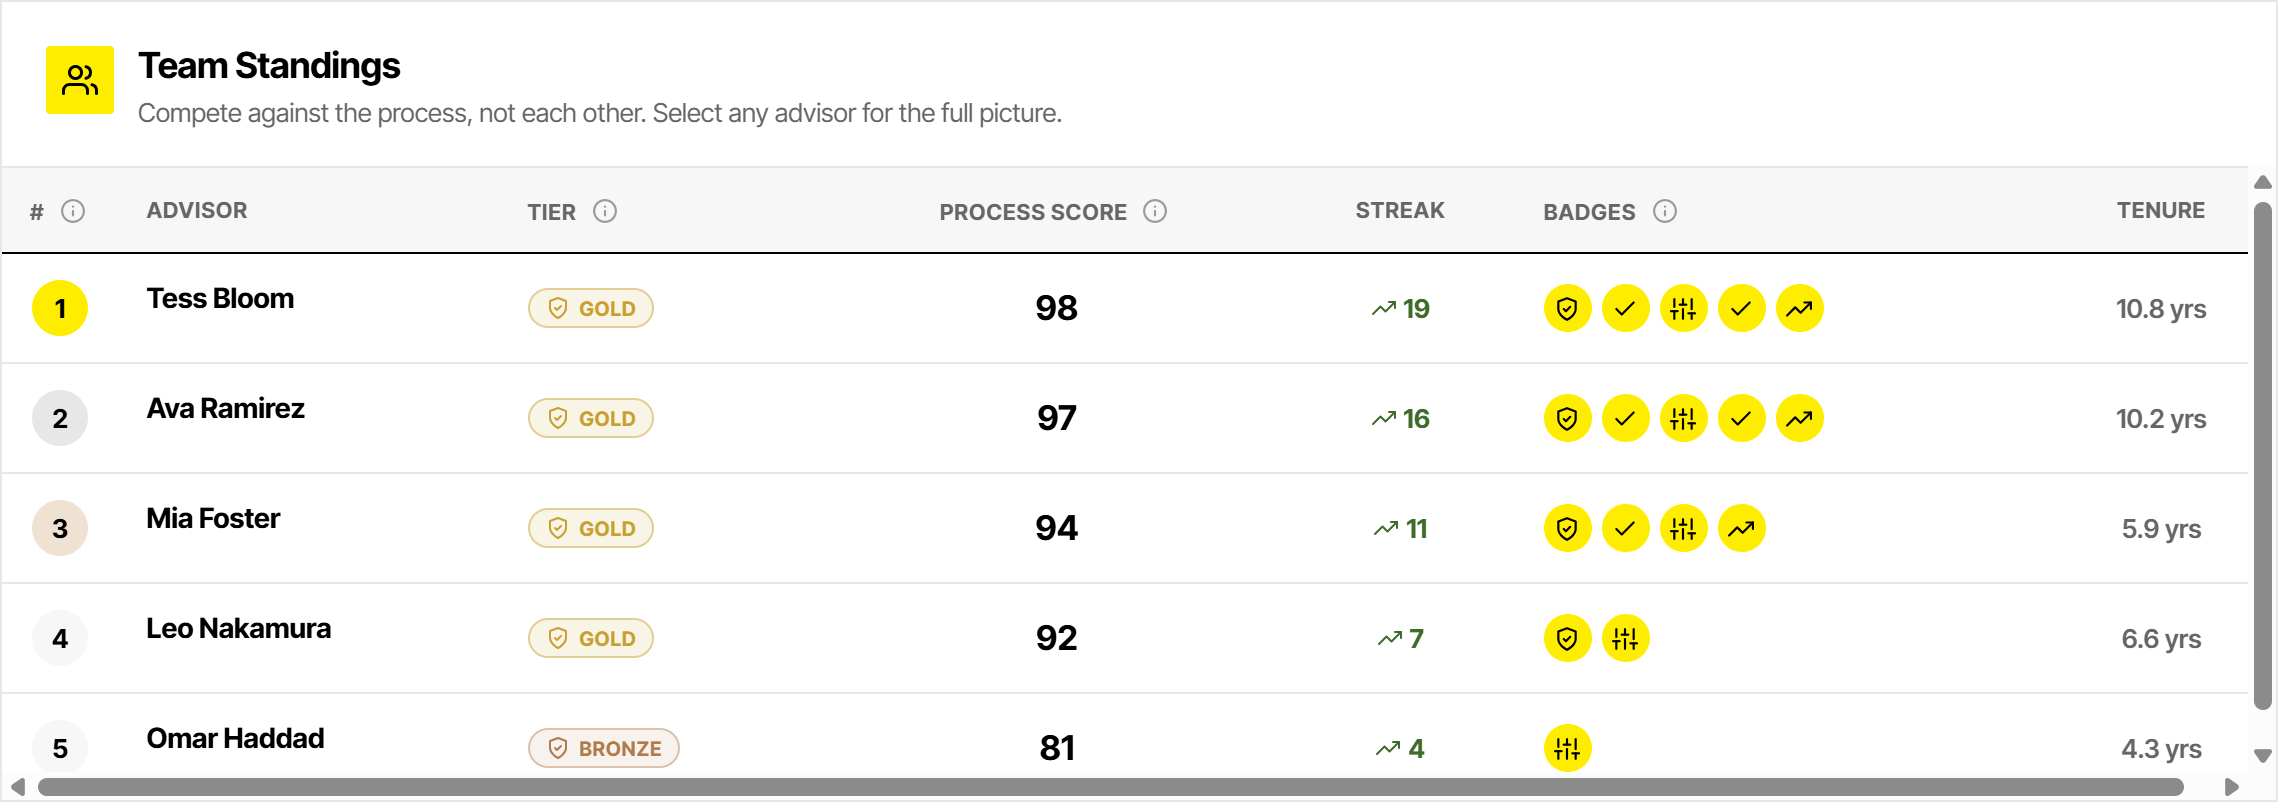
A single process score blends the four CORE metrics with daily accountability, so standing is earned by consistency rather than by who got handed the best traffic. New advisors are tagged as ramping, not failing.

  • Gold, Silver, Bronze and Building tiers based on sustained adherence
  • Most-improved spotlight — momentum counts, not just absolute numbers
  • Badges tied to real process milestones
  • Every advisor sees the same board, so the standard is public
Team standings board with process score, tier and acknowledgement streak per advisor
Also included

The rest of the loop.

Menu sales lost

Every advisor carries a dollar figure for the opportunity they didn't take — modeled conservatively from their own close rate and their own average sale. It turns an abstract percentage into a number a manager can talk about.

Coaching messages

Ready-written coaching notes tied to the exact metric that's short, with the advisor's own numbers filled in. A manager sends real feedback in under a minute instead of putting it off until next month.

Spins & prizes

Earn a spin by acknowledging five shifts in a row, earning a badge, or leading the board — then win from a prize pool you control. Small, frequent, immediate rewards for the habits that compound.

How it works

From connected to coaching
in days, not months.

CORE reads what your DMS already produces. There is nothing for your advisors to fill in and nothing for your managers to export.

STEP 01

Connect your data

We connect to your service data directly, pull your customer-pay ROs, menus presented, menus sold, BG and labor hours, and stand your roster up. No spreadsheets, no double entry, no advisor homework.

STEP 02

Set your standard

Define the target for each metric and the range you'll call green, yellow and red. Your store, your numbers — CORE measures against what you decided, not an industry average that means nothing on your drive.

STEP 03

Run the daily loop

Advisors review and acknowledge their last shift. Managers work the reds. Goals run monthly, rewards get delivered, and the process becomes the thing everyone competes on.

What we hear
“Where have you been hiding this? Total game changer.”
Early pilot feedback
Who it's for

Built for fixed ops.
Bought by the whole store.

Fixed ops directors

One screen that tells you where the drive stands and who needs coaching today — instead of an afternoon in exports.

Service managers

A daily habit your advisors actually complete, and coaching notes that write themselves from real numbers.

Dealer principals

Revenue you already earned but never collected, quantified — and a process you can hold the store to.

Groups & independents

Roll up across stores or run a single shop. Same metrics, same standard, whatever the sign out front says.

Questions

Straight answers.

CORE — what it is, and what it isn't.

CORE does three things.

  1. Establishes the service-drive processes known to maximize revenue.
  2. Teaches, encourages and incentivizes your advisors to follow them — through individual and team incentives, AI-driven coaching and manager tools that streamline communication and surface who on the team needs mentoring.
  3. Measures, reports and makes visible exactly how each advisor and the store as a whole is performing against expectations.

CORE is not a general dealership dashboard. We've been deliberate about using only metrics that serve those three objectives.

Where does the data come from?
Directly from your service data — customer-pay repair orders, menus presented, menus sold, BG products and labor hours. Nobody on your team enters anything by hand, and there is no separate system for advisors to keep up to date.
How long does setup take?
Days, not months. Once we're connected to your data we stand up your roster, you set your targets, and your advisors log in. Onboarding an account, adding advisors and issuing logins is built into the product.
Will my advisors actually use it?
That's exactly why the daily acknowledgement, the standings and the incentives exist. The advisor's own screen takes under a minute a day, shows them their numbers against target, and pays them back in recognition, spins and real rewards. It's built to be worth opening, not mandated.
What metrics does CORE actually measure?
Four operational metrics — menu presentation, menu penetration, BG penetration and labor hours per menu sold — plus revenue impact per customer-pay RO, split into won, lost and net. Every one is measured against the targets you set, so a score means the same thing for every advisor and every store.
Do you set the targets, or do we?
You do. Each metric has a green range and a yellow gap you configure per store. CORE never grades your team against a benchmark you didn't agree to.
Can we run more than one store?
Yes. CORE is multi-store: each dealership carries its own roster, targets, contacts and rollup, and an administrator can work across every account from one login.
What about advisors who shouldn't appear on the board?
You control who is visible and who has a login independently. Hidden advisors still count toward the store's numbers — their contribution is folded into a separate row — so the store average never moves just because you changed who's on screen.
What does it cost?
Pricing depends on your store count and advisor count. Get in touch and we'll walk through it against the opportunity your own numbers show.
Next step

Find out what your drive
is really producing.

Tell us about your store and we'll show you CORE against your own numbers — not a canned demo.